Its summer time, and that means its time to leave the city and head to the mountains, trails, cliffs, and rivers. First stop - Catskills! For today’s analysis let’s look at the rental market in the lower Catskills region. AirBnB has transformed the vacation rental market there in the past couple of years, but what drives a good rental property on AirBnB? What factors in that area lead to a property being able to fetch a higher price?
I took a look at AirBnB properties in three town in the southern Catskills - Pine Bush, Gardiner, and New Paltz. These towns are all around one of my favorite areas - the Mohonk Preserve. There are 136 properties, with a median rental price of $155 per night. New Paltz has the most, at 57 properties (median price $149), then Pine Bush (median price $165), and finally Gariner (median price $145). There are a couple of factors in a home rental that seem to drive the price.
Room Type
AirBnB offers up rentals for private rooms, shared rooms, and whole home rentals. In the Catskills, 63% of the homes are whole home rentals.
As expected, there is a big difference in price for whole home rentals ($195 median price) versus just a room ($100 median price).
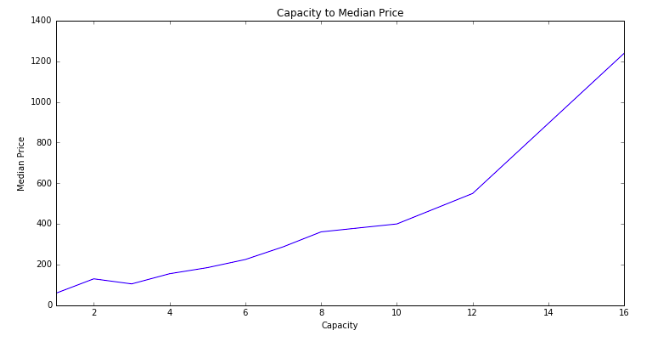
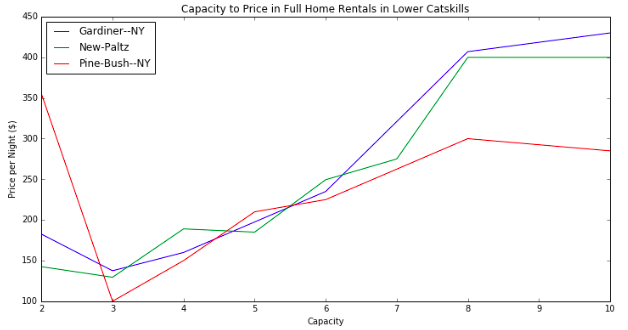
Capacity
How many people a house can hold is the biggest factor in house price, and there is a pretty good linear relationship between capacity and price. The most prevalent property size is for 2 people (33% of all properties), because of the prevalence of single room rentals. Next is 4 person rentals (21%), then 6 person rentals (14%).
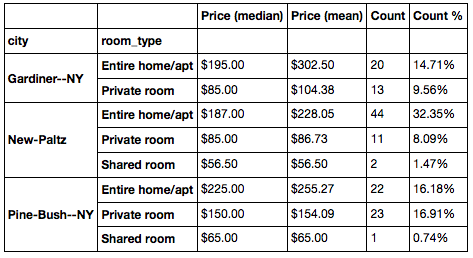
Interestingly, if we look at the relationship of capacity to rental price by town, we can see that Gardiner and New Paltz have a slight edge over Pine Bush.
Ratings
A big part of the AirBnB experience is the rating system. As a renter, you can rate your host on a number of factors. So how do these factors get reflected in rental prices? Looking at overall satisfaction, cleanliness, and communication, it appears like these ratings are a noisy contributor to the nightly price.
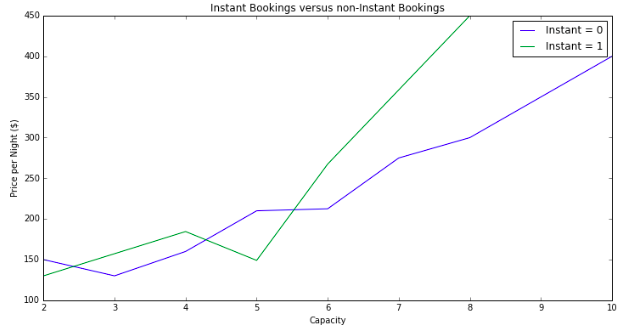
Instant Book
Some properties on AirBnB have the option to instantly book them, rather than going through the negotiation with the property owner/manager. For smaller properties there is not much of a difference, but for 6 person properties instant book homes are on average $67 more per night, and for 8 person homes they are on average $150 more per night. Overall, only about 20% of homes are listed as instant book.
Analysis
All of these factors independently contribute to the house rental price, but let’s build a combined pricing model to see how they interact together. I plugged the rental properties into a linear regression, minimizing the L2 norm with OLS. The scatter plot of the predicted price versus the actual price for the training data is plotted below:
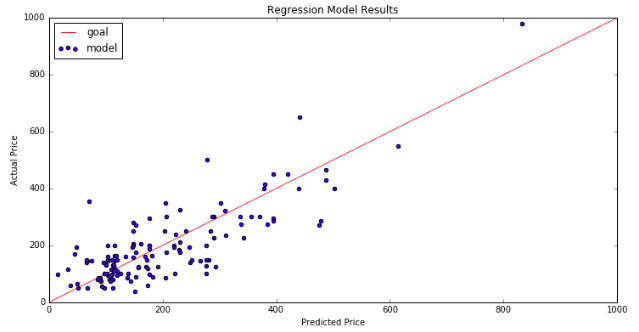
The adjusted R-squared is .66, and the regression F-stat is 27.5. Most of the factors have t-stats over 2 - as mentioned above, the rating factors have the most noise.
If we translate the results of the regression into a more comprehensible pricing model, we end up with something like this:
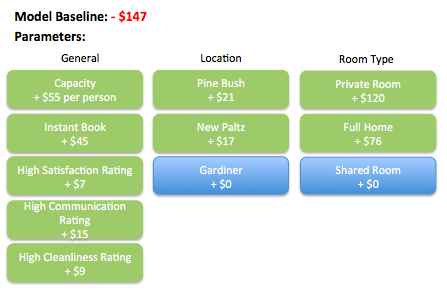
The negative baseline is obviously unrealistic on its own, but with most pricing options added in the outcome becomes feasible (ie, positive). For instance, for a 3 bedroom house in Pine Bush with good reviews but no instant booking, the model predicts a nightly price of $311 = - $147 (baseline) + (6 x $55)(capacity) + ($7 + $15 + $9)(good ratings) + $21 (Pine Bush). Capacity is far and away the biggest driver of price, but this model has some interesting outcomes. For instance, instant book is worth quite a lot ($45 per night).
With a median price of $155 per night, there is really no reason not to go explore some of what the Catskills has to offer. Go check out the Mohonk Preserve, Minnewaska State Park, the Shawangunk Wine Trail, or the awesome tasting room at Angry Orchard.