28 Oct 2025

The NYC Toilet Challenge: A 579-Mile Marathon Nobody Asked For

Did you not make it into the NYC marathon this year? I have an alternative for you…

If you have the right mixture of ambition and questionable GI state, then here is a route that connects all of NYC’s public restrooms for you:

NYC Toilet Run

In total it is a mere ~579 miles as the crow flies. At 100 calories per mile, that is 57,900 calories required, or about 165 Beef Chalupa Supremes.

This was generated using NYC’s open dataset on public restrooms. Since solving the shortest path is tantamount to the traveling salesman problem, this is an approximation using nearest neighbors with some pre-computed clusters (and special handling for Staten Island, because, well, Staten Island is special…). The route looks reminicent of the listeria adhesion protein shape that is probably very active in anyone’s belly that attempts this.

Tighten your laces, eat that questionable leftover food from last night on your counter, and I will see you out there.

nyc running publicrestrooms

24 Oct 2025

Got to go? NYC has about 1066 public restrooms that might be of use to you. Thanks to pretty meticulous record keeping we can get some insight into how well the restrooms service the city. Let’s dive in!

Overall

1066 restrooms sounds like a lot, but in fact it is pretty low for a city the size of NYC. Looking at the 100 biggest cities in the US, NYC is ranked 93rd in terms of restroom availability with 16 restrooms per 100,000 people (St. Paul is ranked first, with 210 restrooms per 100,000). There are some efforts to improve this, in particular a recent push to nearly double the number of bathrooms by 2035, however that is going to be hampered by the high cost of building or renovating, and then maintaining, a bathroom in NYC - some analysis puts it at $3.6M to build a restroom, and at 1000 additional restrooms needed to double, something has to change on a cost front.

Here they are scattered around the city: Restrooms

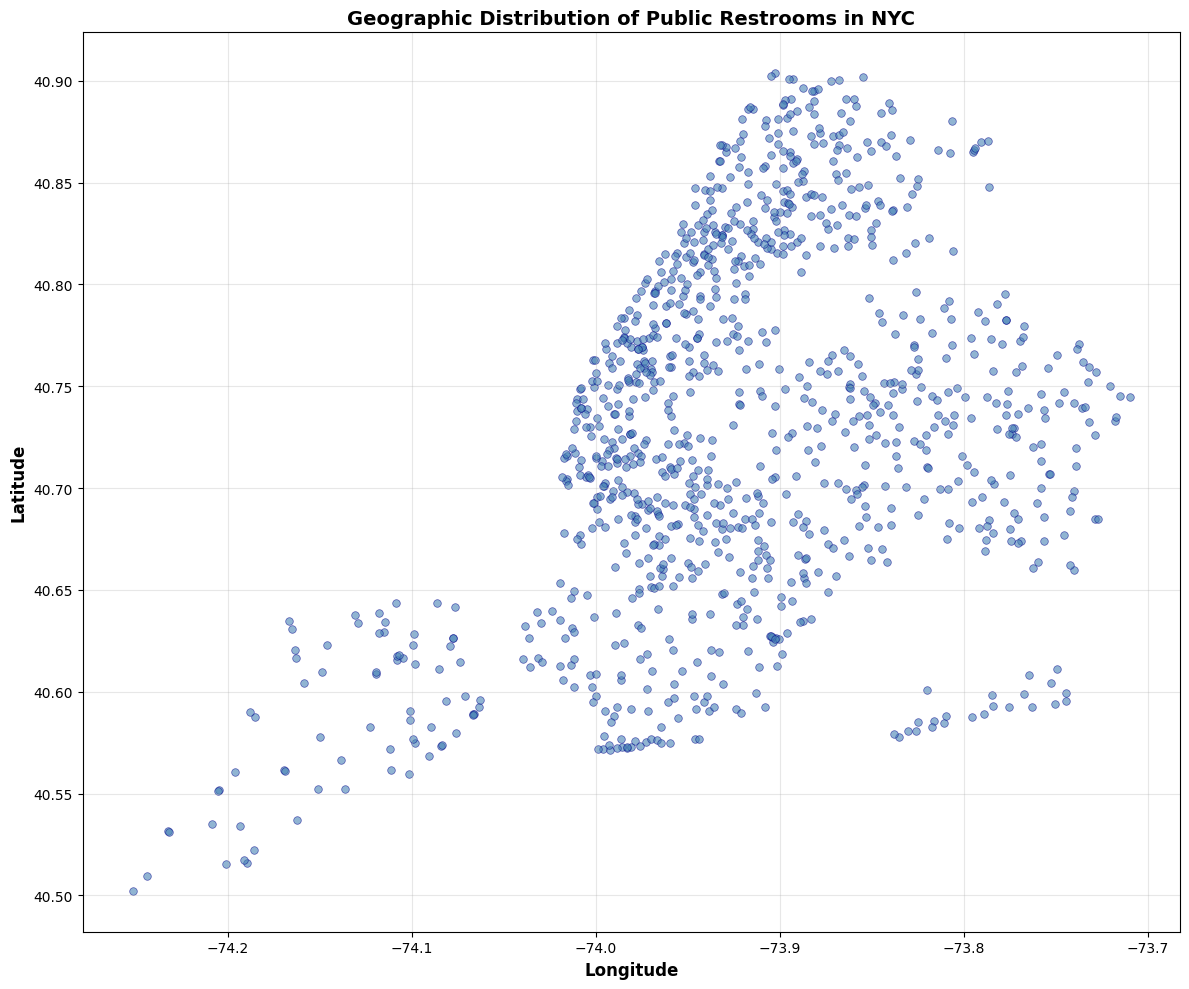
There are some great resources for digging further on the geographic distribution of bathrooms, in particular:

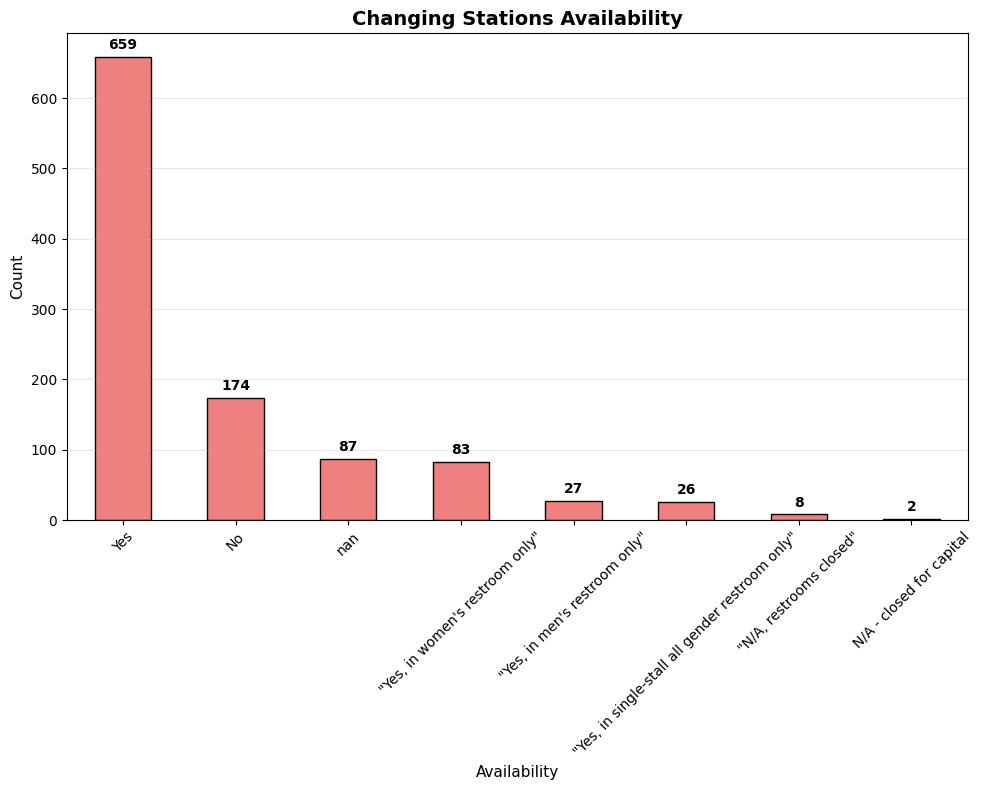
In general, the restrooms that we have are fairly well equipped - 62% of them have changing stations and 58% of them are fully accessible.

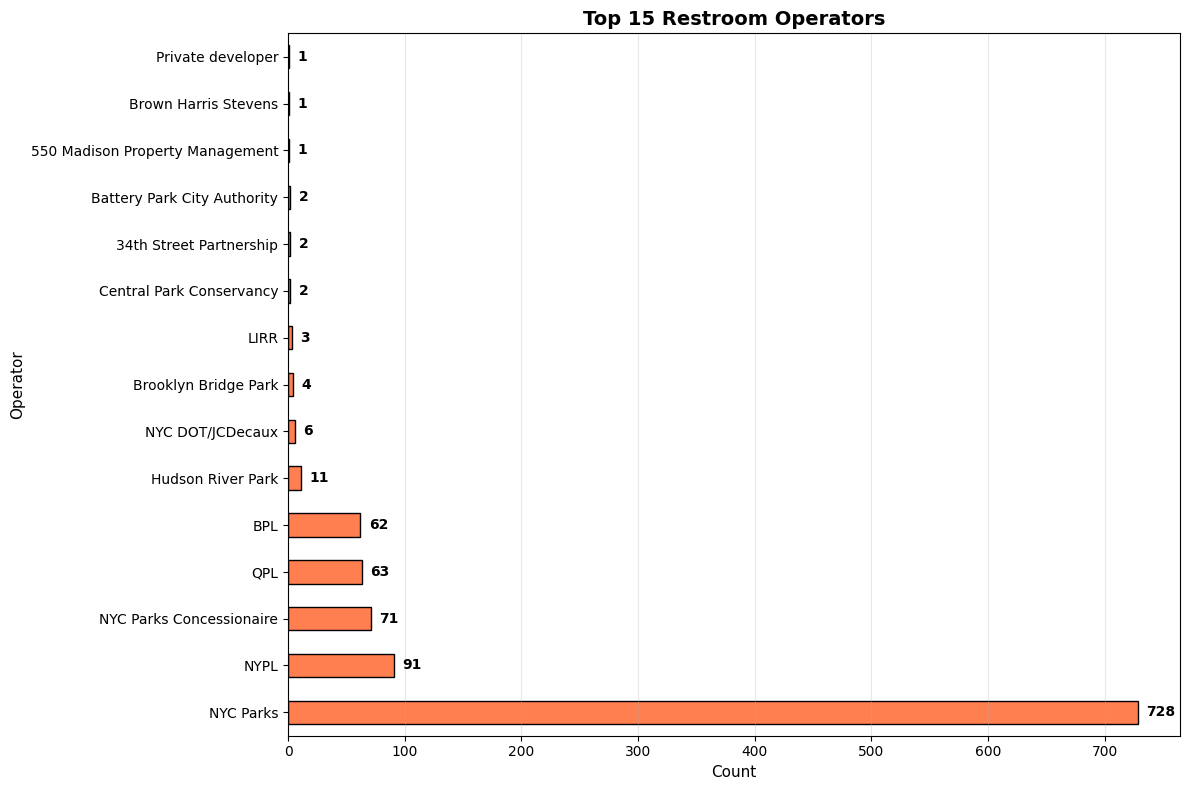
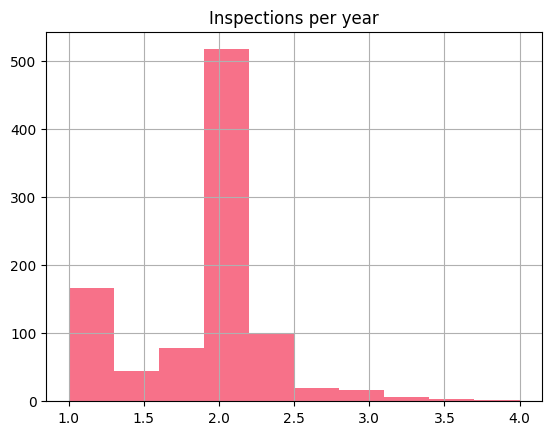
Public restrooms are operated by several city agencies, including the transportation authority, libraries, and parks. The parks service maintains the majority of them (728/1066). In 1997 the NYC parks service started keeping records on the cleanliness of public restrooms through the parks inspection program, which can give us some insight into how clean these facilities are. Park restrooms are inspected on average twice per year, and are graded for overall quality and some details like the amount of litter, graffiti, and structural issues. Let’s get into some questions you might have about NYC’s potties!

How clean are our restrooms?

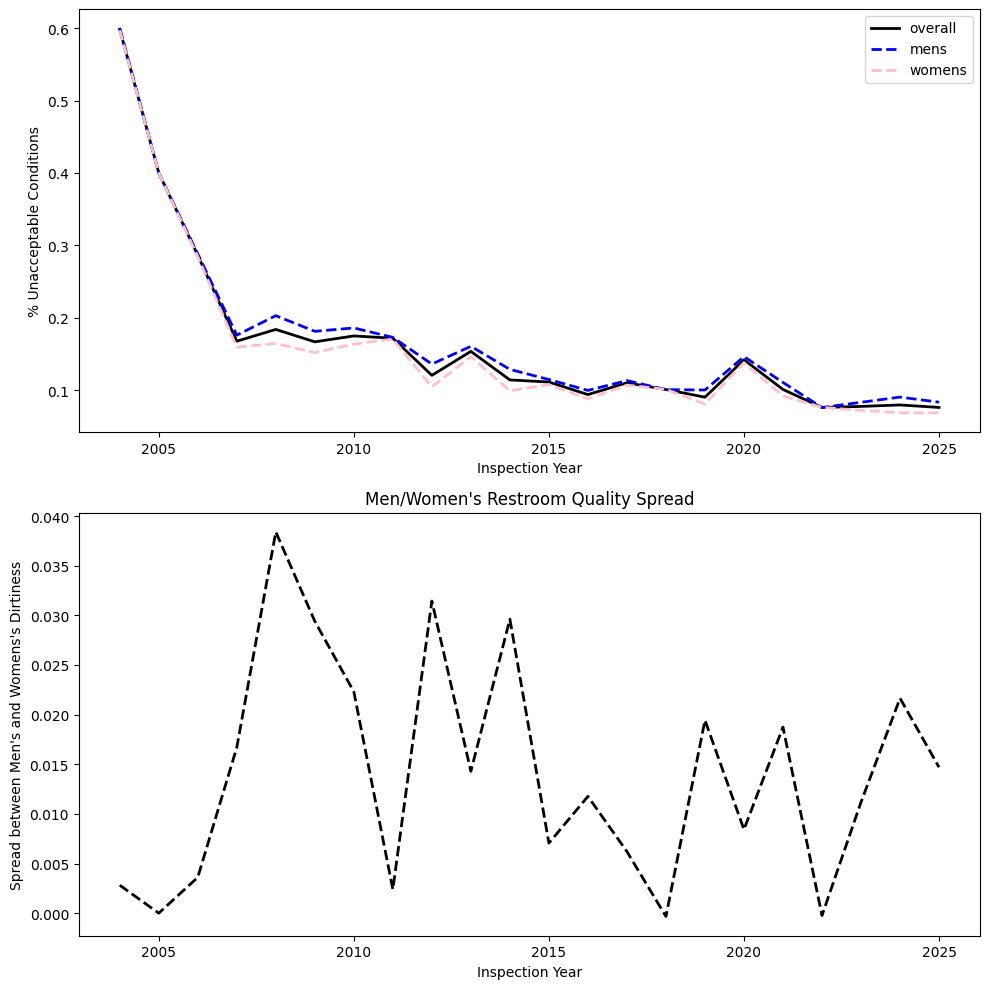
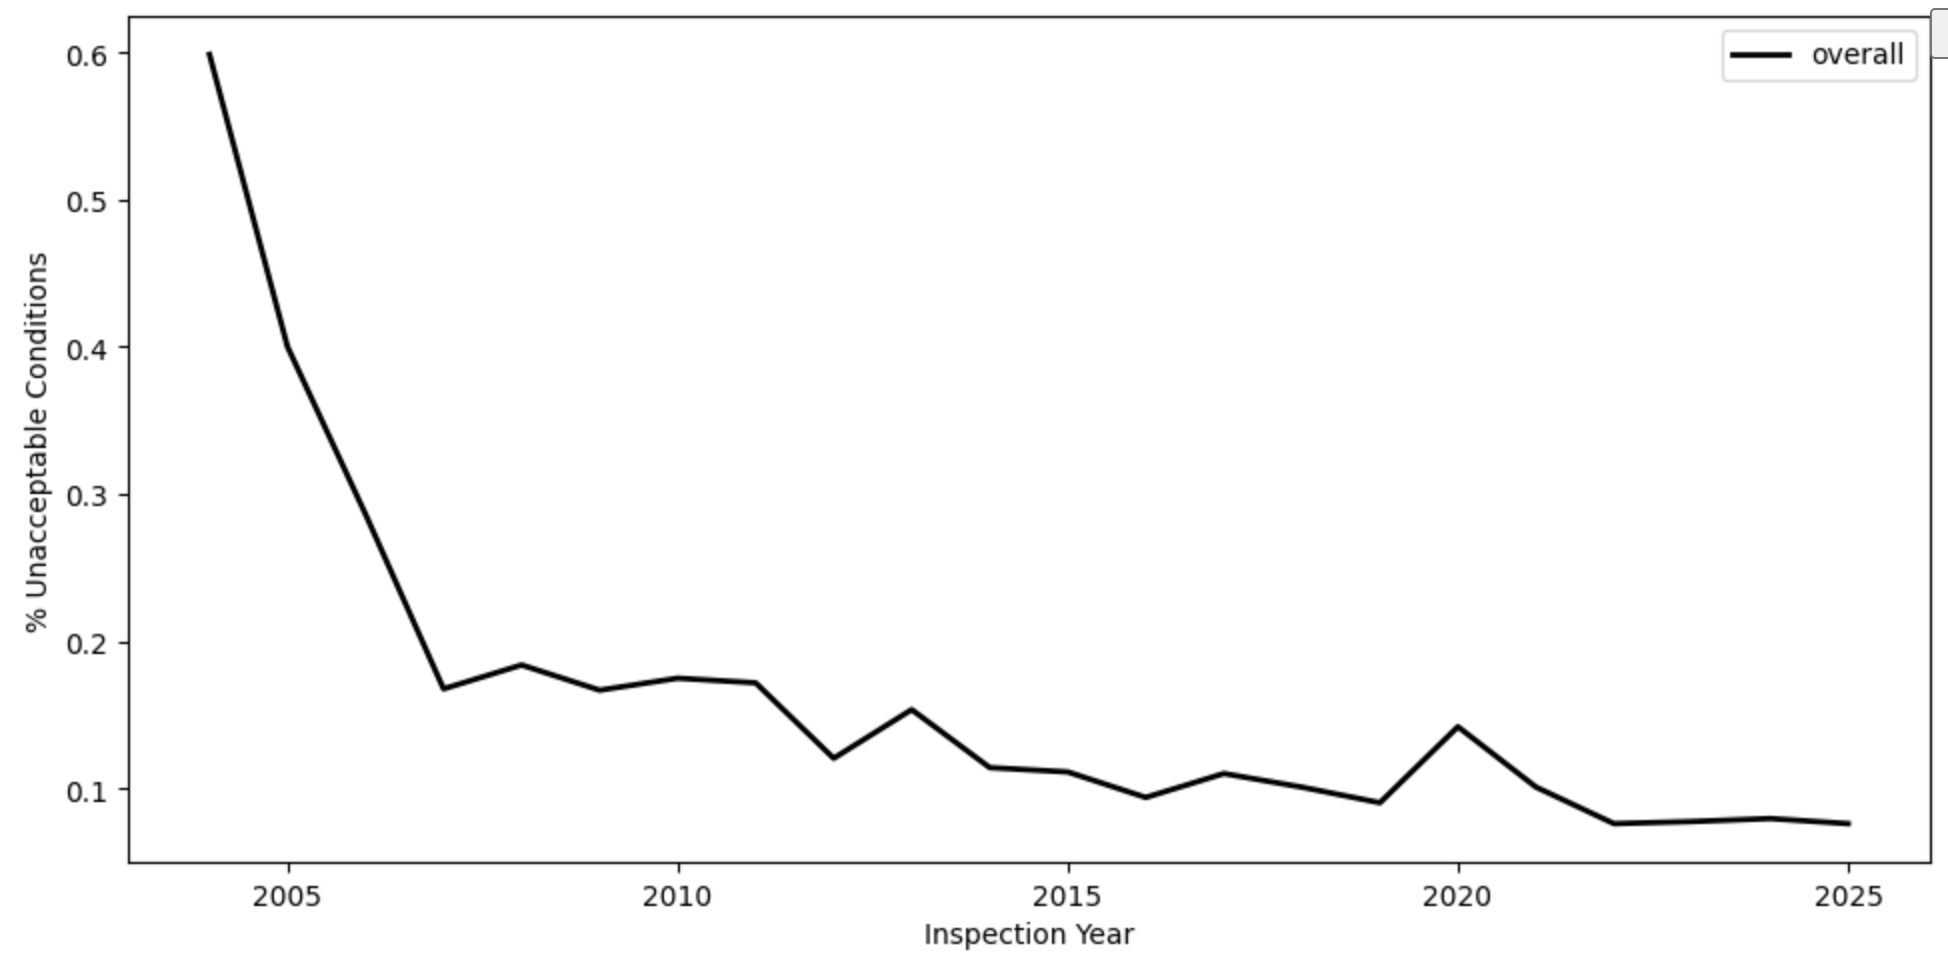
Not bad according to the data - of course, we should all manage our expectations when we walk into a public facility. Conditions appear to have been steadily improving, with recent numbers showing that only ~15% of facilities are in unacceptable condition. That data has a “dirty bump” in 2020, likely due to the realities of NYC during the pandemic. The dominating features that lead to unacceptable conditions are litter and missing soap (16% of the cases each), though missing toilet paper is a common problem (7% of the cases).

Are men or women messier?

An ancient question that the restroom inspection data can give us some insight into… turns out men’s and women’s restrooms are fairly equal in terms of conditions, with men’s rooms slightly (but consistently) edging out women’s rooms in terms of grime. About 15% of men’s rooms are categorized as unacceptable, versus 13.6% of women’s rooms.

Mens versus Womens

Does restroom cleanliness correlate with wealthy areas?

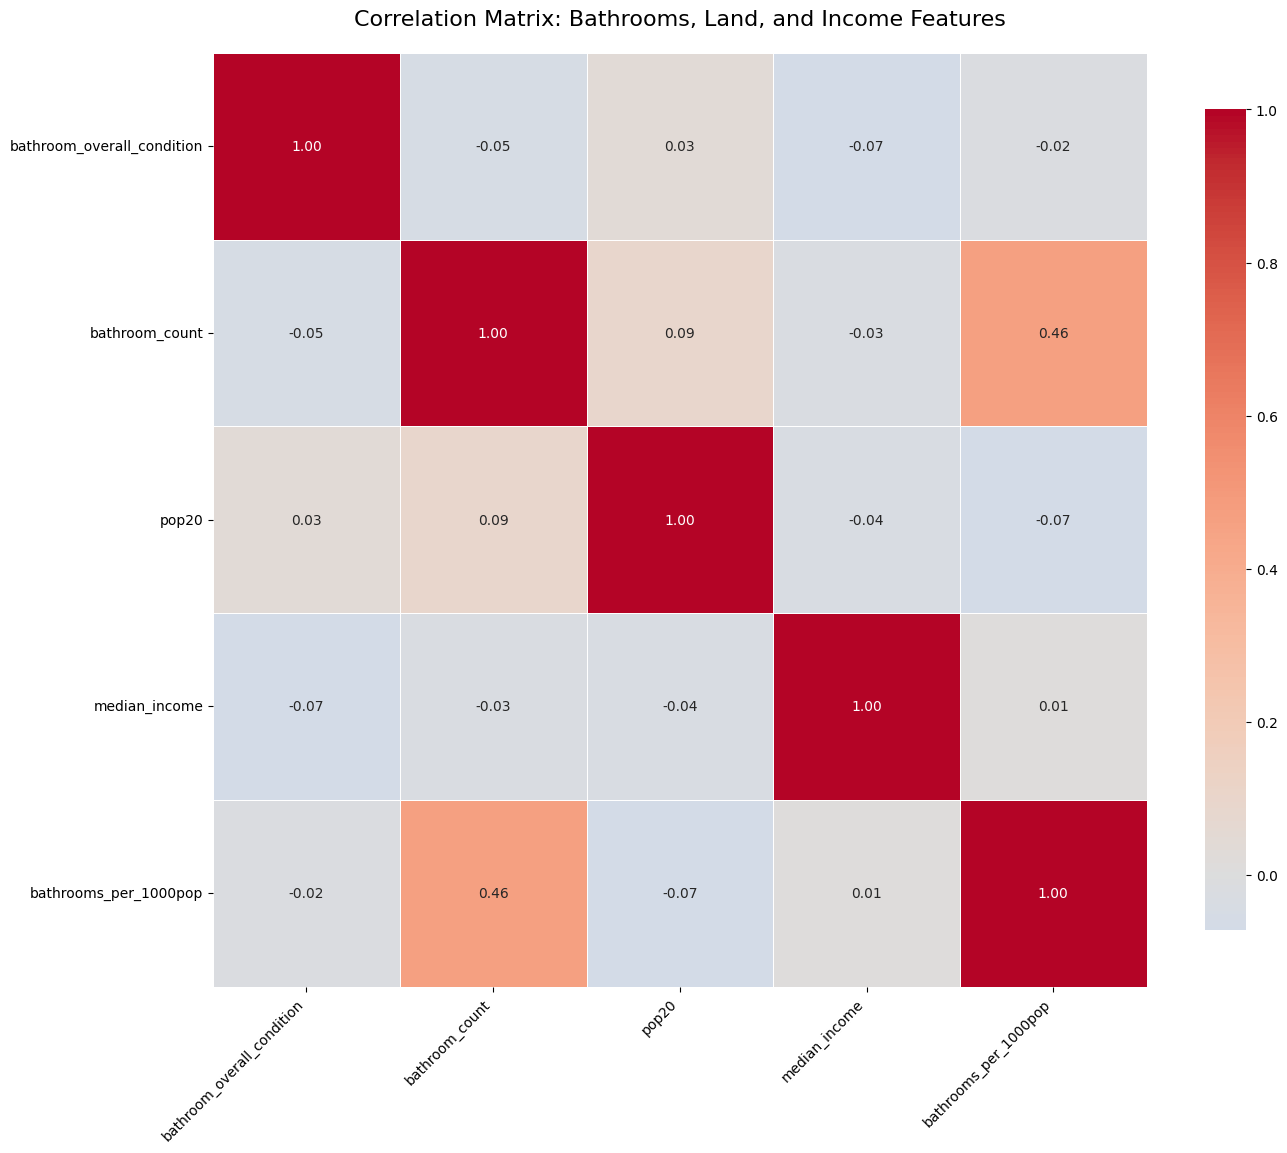
I had a (pessimistic) hypothesis when I started this analysis that I would find a relationship between facility cleanliness and the wealth of neighborhoods. After all, the nicest public bathroom in NYC is located in a high end neighborhood (Bryant Park), and its renovation and upkeep is funded by a private coalition. That seems like an outlier though; the correlation between median income and restroom quality is directionally aligned, but weak at only 7%. That points to a fairly equitable maintenance program.

Correlations

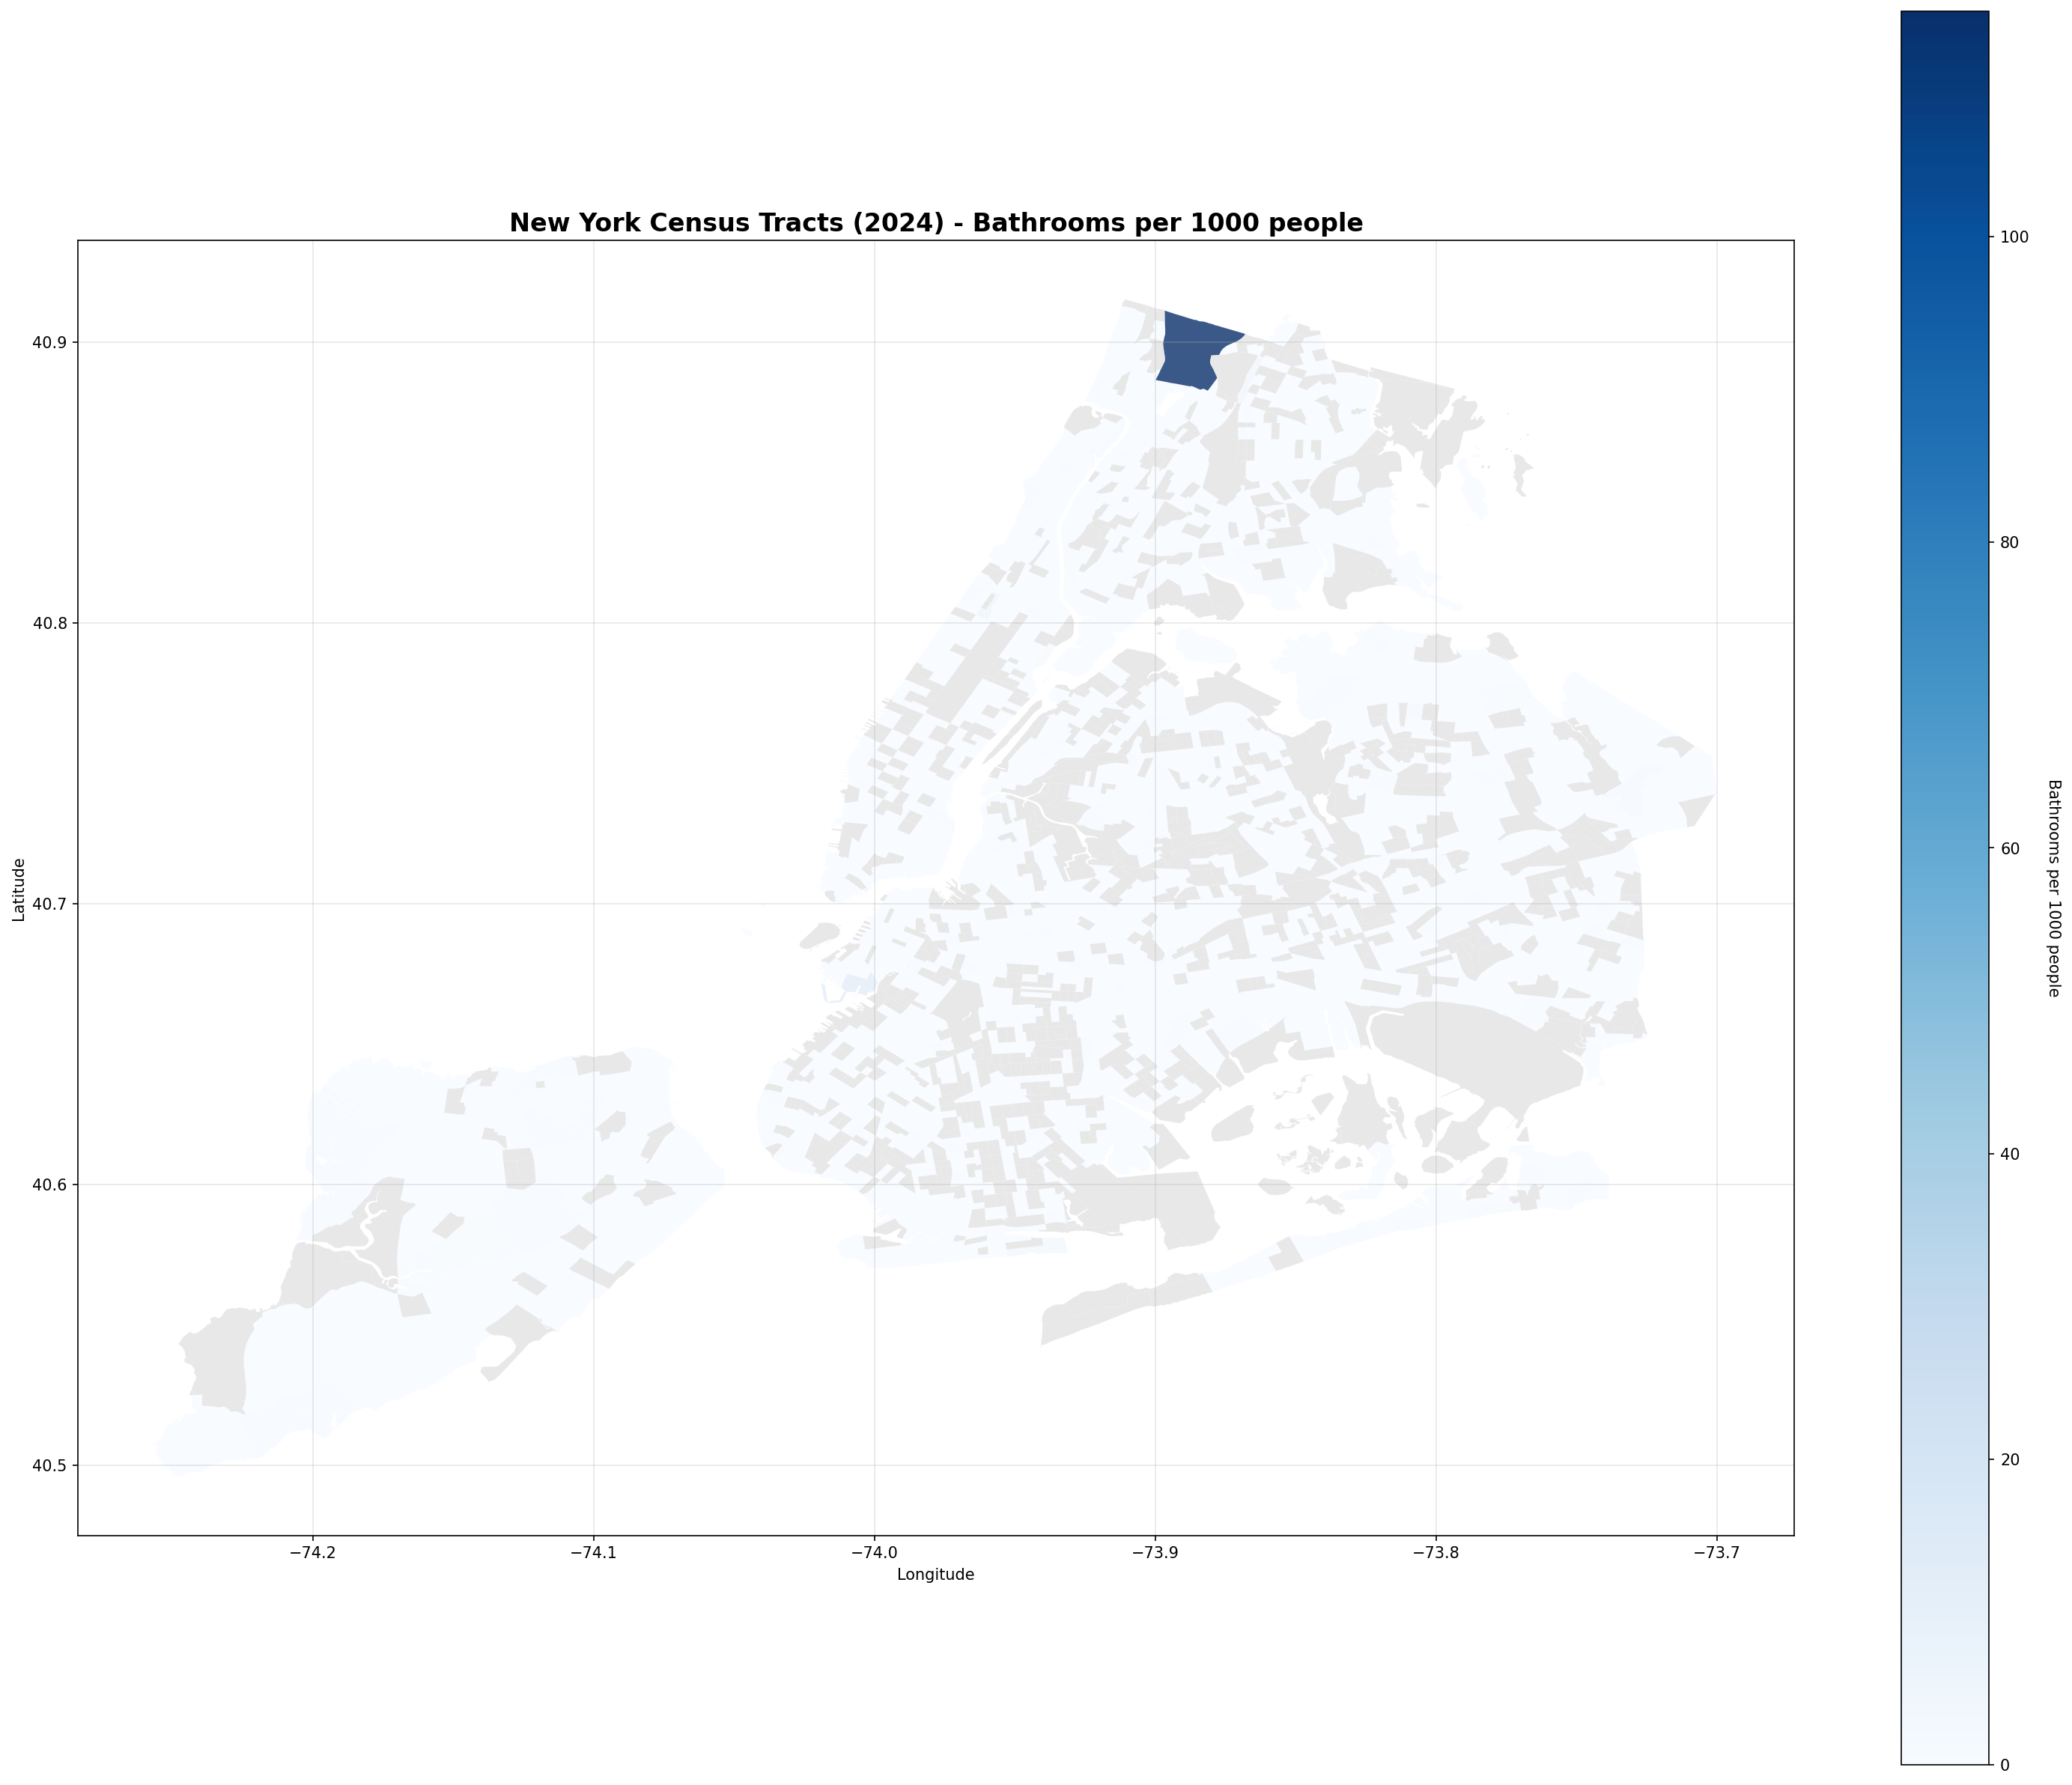
Are restrooms evenly distributed in the city?

Looks like it - controlling for population and excluding hot spots like highly visited public parks, restrooms density loosely matches population density.

Population Density

Parting Thoughts

The public restrooms in NYC seem to be fairly distributed and managed well, but there is not enough of them, and it is not clear from the data that there is an easy answer for that. We need to build more restrooms everywhere in the city to get us closer to top-tier cities higher in the rankings.

nyc parks inspections publicrestrooms

03 Oct 2025

You are lying on a blanket in the park, soaking up the rays, watching kids run around, and you reach over to find… broken glass? If you have been in the city long enough you have had an experience like this. Our parks are usually beautiful communal spaces, but it is impossible for them to escape the tradedy of the commons - good news though, since 2017 NYC has been collecting inspection records of how clean our public space are, and things are getting better!

Records indicate that since 2022, we have observed a 34% decrease in “filth” in our parks (and yes, the level of inspections appears constant at around 3,000 per year). The inspection data includes flags for the presence of five issues - animal waste, broken glass, illegal dumping, graffiti, and medical waste. Each of them have gone down in the past 3 years:

Category % Decrease
Animal Waste 29%
Broken Glass 31%
Illegal Dumping 39%
Graffiti 40%
Medical Waste 50%

Let’s focus on the two biggest drops - graffiti and medical waste.

Where did all the graffiti go?

NYC is a mecca for street art, some of which is iconic, other that is a nuissance. Since 2021 there has been a focused effort to remove illegal graffiti around NYC. Despite the efforts, Highbridge Park remains a leading place to spot graffiti.

Graffiti Ranking

As an aside, I used to live near 5Pointz, which was demolished and converted into whitebox apartments where you can rent a studio for $4k a month. Conflicted feelings on that one…

Wait, medical waste?

Yes, medical waste. In fact there is a whole dataset devoted to tracking syringes in NYC(perhaps to be explored on a later date). Data on medical waste is a little suspect - in particular, in 2022 Marine Park far surpassed every other park for medical waste sightings, with more then 50% higher than Highbridge Park in second place, however in subsequent years sightings dropped to at or near 0. This harkens back to a terrifying incident in the 80’s called syringe tide, where medical waste washed up on CT, NJ, and NY shores, devastating local businesses.

Looking at the concentration of medical waste in our parks, looks like the current “leader” is Estella Diggs Park:

Medical Waste Ranking

If the description of Estella Diggs Park is meant to be true - particularly “encourages kids and New Yorkers of all ages to come outside” - then perhaps it is an area to focus prevention efforts.

Where is this going from here?

It is great that there has been an overall drop in “filth” in our city. More can be done though - and in 2025 Mayor Adams established significant permanant funding for the Department of Sanitation to continue efforts to clean our parks, including the second shift program to provide daily focused cleaning efforts for our highest use areas. It seems optimistic that we should continue to see the trend towards cleaner parks, and a little less broken glass when you are lounging on those warm summer days.

nyc parks inspections waste

25 Sep 2025

I preface this by admitting I am very late to the game - I have seemingly had my head buried in the sand as all of the LinkNYC stations went up around the city. It is not that I was not aware of them - they are nearly impossible to miss, with their digital ad displays, tablets (occasionally flashing explicit material…), and dubious looking plugs. I had not asked “why” though - and so here is what I found after a little digging.

There are 2308 of the hubs erected around the city, with 53% of them being located in Manhattan. There is sort of a patchwork distribution of them scattered around the 5 boroughs, with some heavy concentrations in the familiar areas. LinkNYC Kiosks

Across the whole city, only 20% of census tracts have 1, while some (like in Red Hook or near Times Square) have many. In general, after removing a few outliers and controlling for population density, the distribution looks fairly reasonable. LinkNYC Units per 1000 People Distribution

How many would be needed to completely tile the city?

Each unit has an optimal range of about 150 ft and a maximum range of 400 ft. So assuming the units were optimally distributed, how many would it take to tile the whole city? 2308 seems like a lot, however it would actually require up to 119k of them to completely cover the city. Enter the the 5g variants of the towers, which have a range of 750 ft - we would only need 4740 of those to tile the city (ignoring for a second the difficulty those little 5g waves have in actually reaching people).

Internet for All

One of the objectives of the program was to provide internet to the least advantaged residents of NYC. The 5g program in particular seems to be targeting that - the 262 5g towers that have been built so far are generally distributed towards lower household income areas (on average, areas with 5g towers have 23% lower median income than standard towers). LinkNYC 5g Distribution

Who Pays for this?

Advertisers! In fact, NYC appears to get a kickback from the program. In 2024 NYC booked $5.8M in revenue from the program, thanks in part to its contract to harvest 5% revenue LinkNYC makes from operating the digitial ad displays. Revenue is also harvested from leasing the 5g tower space to 3rd party carriers. Of course, this is all a little far off the astronomical initial projections, which was supposed to generate $500M over 12 years, but the deal was restructured in 2021 and appears to be smooth sailing now. Not bad for a municipal project!

What did we lose?

Phone Booths. The LinkNYC stations originated from a De Blasio program to replace the aging phone booths around the city. And it was successful in that - in 2022 the last phone booth was removed from 49th street and 7th ave. I suppose I am waiting now for Hollywood to do a reboot of Phone Booth centered around the LinkNYC stations.

nyc wifi phonebooths linknyc intersection