I made a point in my last point about differentiating between a change in the crime rate and a significant change. I want to elaborate on that point a little more, because this is something that is so often overlooked but is vital to understanding any analysis. So if you know all of this already, feel free to skip the next two paragraphs.
When someone quotes a stat, like saying that overall major felonies were down 1.6% in 2015, they are only presenting part of the story. It is not a lie - crime was really down 1.6% in 2015 - but you need to ask is that significant, ie, is that something real or could it be random noise. This is where a more adroit publication would quote a significance level, or p value, but I personally do not find them intuitive. So here is my explanation in a nutshell. Something like the crime rate is going to have a natural fluctuation. Crime stats are a complex system, a lot of factors move the stats, and this all contributes to what amounts to random noise.
Luckily, we have ways of dealing with this randomness, and determining the degree to which stats are part of it or not. We ask the question “what is the chance that this stat is because of noise, versus a real effect” and say something is significant if it is above a certain threshold. Commonly, that threshold is 95%, but it is important to recognize that it is not binary - the probability exists on a spectrum, even though we use this shorthand of calling something “significant” or not. We do this by calculating the variance of the changes, which is a measure of how much they bounce around. Through a simple transformation we turn this into a standard deviation. Back to our example, the standard deviation in the crime rate in NYC from 2001 to 2014 is 3.97%. Using what is called a normal distribution (which is a pretty awesome math thing in its own right), we can judge how likely particular values are to be noise. The normal distribution tells us that at one standard deviation, i.e. a 3.97% rise or fall, there is a 32% chance that what you are measuring is noise. And at two standard deviations, i.e. a 7.94% rise or fall, there a 5% chance that what are are measuring is noise, or said differently, you are 95% confident in the measure. That is a normal cutoff- 95% - but as you can see, there is more to it than just a significant or not explanation.
What does this mean for the NYC crime data? The 2015 stats suggest a 1.6% drop in major felonies, however the standard deviation of the crime rate is 3.97%, so this nets out to about a 69% chance that what we are measuring is noise. So that is to say, we cannot really say much. The drop in crime rate for 2015, based on these assumptions, is just not significant.
There are some precincts though which do have a significant change in crime rate in 2015:
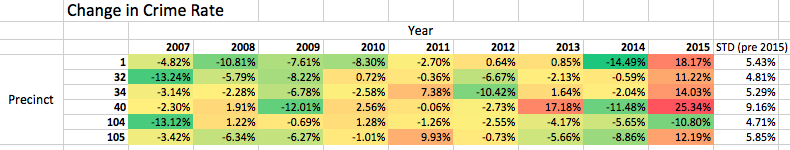
The picture does not look great, of the 6 precincts that had a significant change (using the 95% cutoff), 5 had a turn for the worse, and there is some evidence that the one good one is a misnomer. Here is a quick rundown of what I was able to find for each:
- 1st Precinct (Tribeca area) - 2.5 stars on Yelp, seems like grand theft auto is on the rise in that area.
- 32nd and 34th Precinct (Harlem) - looks like they have a good connection with the community, however the head cop transfered out in 2015 (story). It looks like there was a significant rise in murders in these precincts.
- 40th Precinct (Mott Haven, Bronx) - with a 25% rise in crime in 2015, this begs for some serious questions about what is going on. And it looks like the NYT did some in depth reporting on this. Also, this precinct was caught juicing their 2014 stats, which makes any numbers coming from this precinct highly suspect (and statistically speaking will make it difficult to make any assertions about crime stats moving forward - so the impact of this will last for years).
- 105th Precinct (Queens Village)- this is a huge precinct, and it looks like it is split to better serve the community.
- 104th Precinct (Ridgewood, Queens)- the one darling, with a 10.8% drop in major crimes, however cursory investigation yields articles like this and this, suggesting that the drop in crime rate has more to do with cops not responding to calls (earning them 1.5 stars on Yelp).