I stumbled on a pretty awesome dump of NYC bike stats recently through the NYC OpenData project. Apparently, every year on a particular day in the fall teams go out to specific locations throughout the city and collect data on a bunch of bike related measures - such as how many riders, the split between male and female riders, whether people are wearing helmets, etc. They have been doing this consistently since 2005 in 10 locations throughout the city. With all of those counts, it makes me wonder if I have ever been counted as part of this program! Here are some interesting things that I found.
Ridership
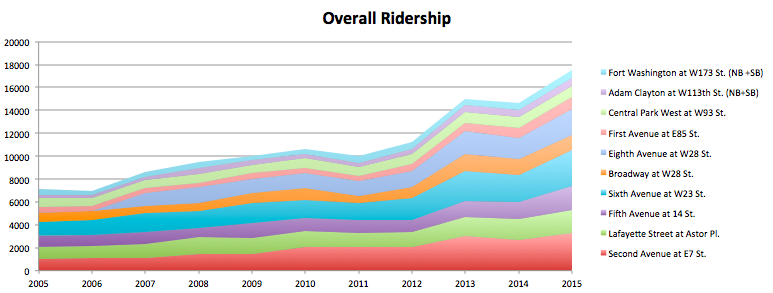
In general, data suggests that bike riding is on the rise in NYC. On average, the ridership has gone up 10% year on year. I would argue that this is a lower bound, and the real growth is more likely to be higher. I say this because the growth is a little erradic, and I am guessing that surveying was done in poor weather in some years (like 2014, where there was a 2.35% drop in ridership despite a 32% growth in 2013 and a 20.84% growth in 2015). Ridership is growing throughout the city, but as you can see below, lower Manhattan has been pretty dominate in the ranking of areas with the most riders.
![]()
Gender
It is pretty clear that there are more male riders than female riders in NYC, but it is a little surprising to see just how off balance it is. It is about 80% male versus 20% female, and while that has come down a bit from 2005 (14% female and 86% male) the change is not that signficant and women are still vastly under-represented in the bike lanes..
Helmet Usage
Let me just start by saying that there is no good reason not to wear a helmet when riding a bike in NYC. To each their own, but I question anyone’s intelligence and/or sense of self worth when I see them riding around without a lid. You can be the best cyclist in the world, but all it takes is a pedestrian staring at their iPhone stepping into the bike lane, another less coordinated cyclist clipping your wheel, or a passenger opening a door without looking to land you in the hospital. And with a helmet, you are more likely to walk out of that hospital and ride another day. </sermon>
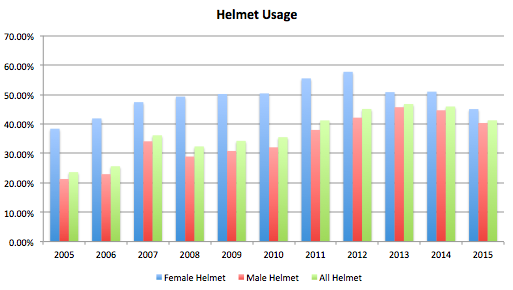
Helmet usage is pretty disappointing in NYC. Based on the stats, it looks like only around 41% of riders wear helmets. Women are better about it than men, with 45% of women versus 40% of men wearing helmets, but even 45% is pretty low. Pro tip: NYC gives away helmets for free, find out more information here.
Bike Lane Usage
There are some good reasons not to use bike lanes sometimes (like cars parking in them), but in general I would argue that riding in the bike lane is safer than riding in traffic. The hierarchy might look something like: bike lane > traffic > against traffic > biking on the sidewalk. Don’t bike on the sidewalk. Seriously.
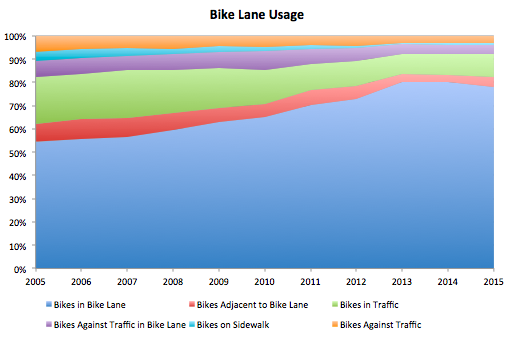
Looks like NYC does pretty good by this measure, and is getting even better. Most riders were counted in the bike lanes (78.15%), very few on the sidewalk (0.83%), and not many riding against traffic (3.91%). Back in 2005, 4.09% of riders were counted on the sidewalk, so we can see a big improvement in this regard.
And here is a handy link to the laws for cyclists in NYC. No biking on the sidewalks!
nyc bike safety opendata