A lot has been made recently about a jump in the crime rate, so I decided to take a look at the major felony rates in NYC, with the help of the NYC OpenData project. There you can find records of all the major felonies reported, going back to 2006, with location and felony classification. Off the bat, it is pretty easy to look at the number of crimes committed over time:
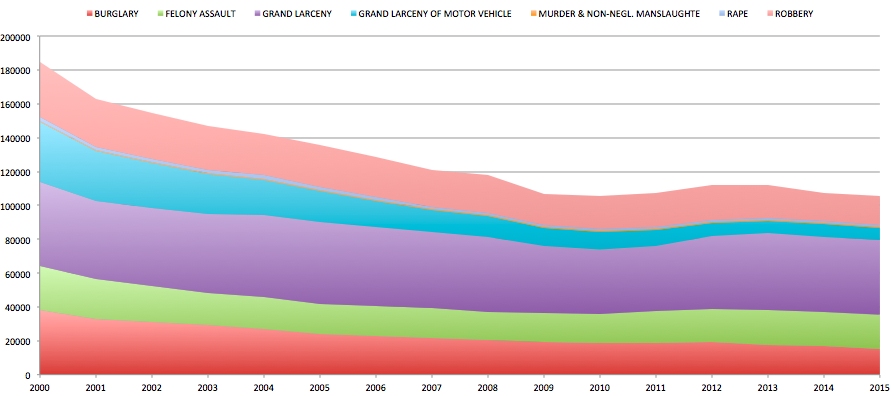
As you can see, crime is down overall. But in all honesty, I look at that graph and I see a pretty steady line, dominated by grand larceny (ie, stealing). But, lets dive in, and look at the rates of change of individual crimes:
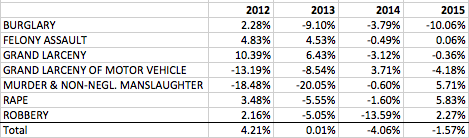
Ok - so one conclusion to draw from this is that there is a 5.71% uptick in murders and a 5.83% uptick in rapes in 2015. While tragic in their own right, taken in isolation I would advise that those rates are a little misleading. If you look at the totality of the history we have, going back to 2001 at the aggregate crime level, one standard deviation for the rate of change of murders and rapes are 6.49% and 7.94%, respectively. So that is not to say that the upticks are a good thing, because they certainly are not, but they are also not necessarily indicative of a regression in crime rates, rather they seem to be within the normal fluctuations of the system. Contrast that with burglary rates, which dropped by over 10% in 2015 and have an annual standard deviation of 4.11%. This is more likely a relevant drop.
Worst Areas
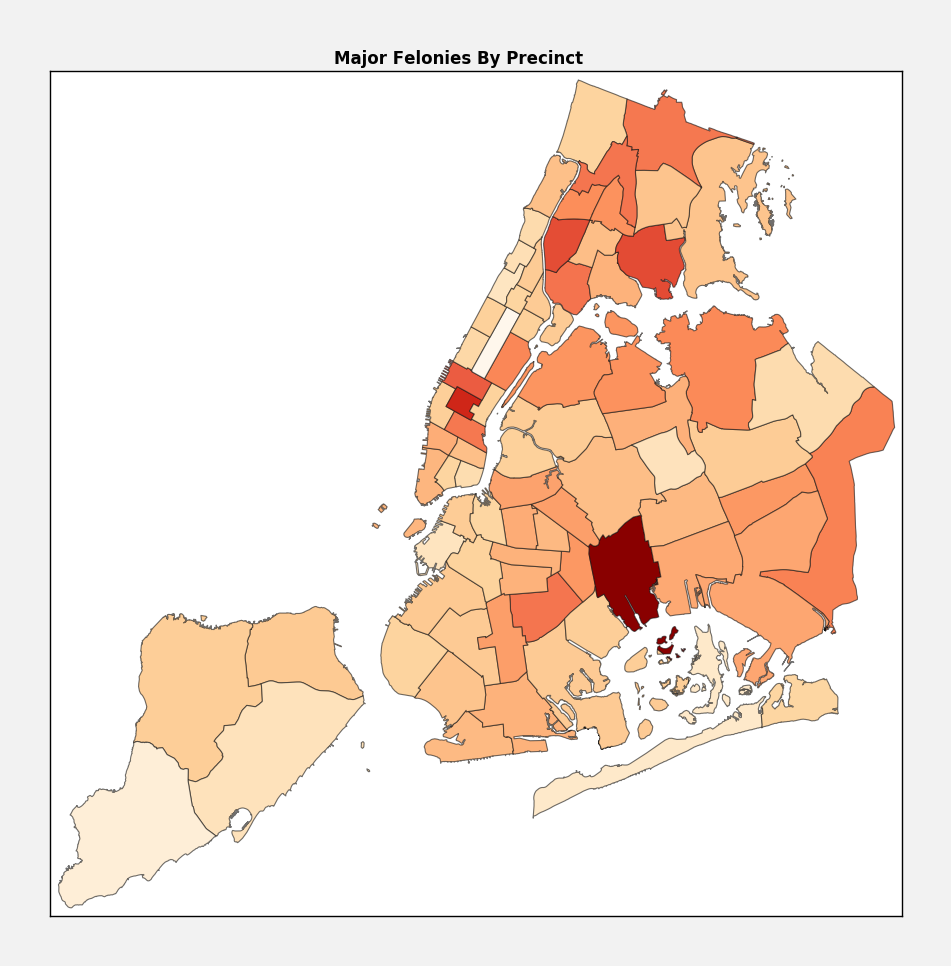
The top three police precincts, ranked by total number of the 7 major felonies, are 75 (East New York, Brooklyn), 14 (Midtown South, Manhattan), and 43 (Sound View, Bronx). If you are surprised by Midtown making the list, it is because of an extremely high count of larcenies - 16% higher than any other precinct.
Changes in Crime Rate
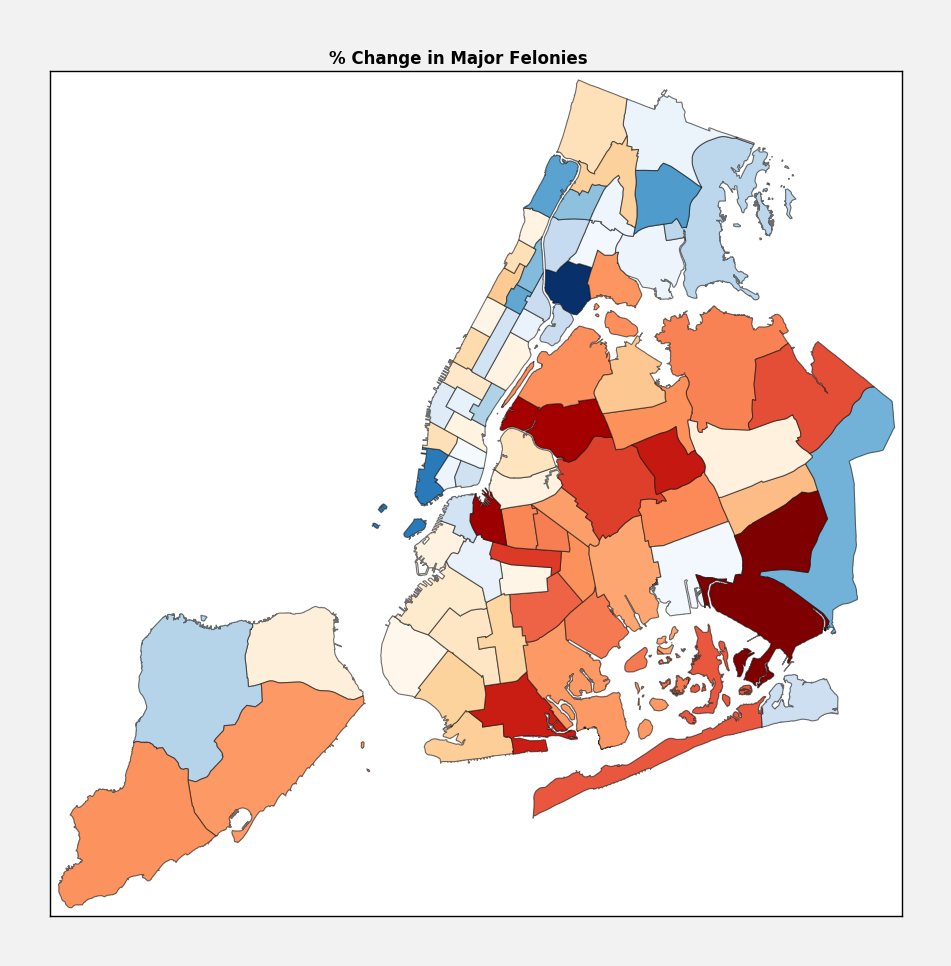
Precincts in blue have a drop in crime rate (good), whereas red has an increase in crime. The top three police precints, ranked by the rise in total crime rates of the 7 major felonies, are 115 (Jamaica, Brooklyn), 88 (Clinton Hill, Brooklyn), and 108 (Long Island City).
Methodology
The map plots in this writeup are done using the basemap package from matplotlib. NYC provides useful shapefiles for all of its census tracts, those can be found here, and you can also pull down the crime rate data from NYC OpenData. I am happy to make available any raw data/code used, just ask.
nyc crime opendata