Sometimes when it is hot out there is nothing more refreshing than escaping the heat in the shade of a tree. Luckily, in NYC there are thousands of trees planted along our streets, and NYC has done a great job in distributing them around the city. And better yet - thanks to the efforts of TreeCount NYC, we know the exact location and health of all of them!
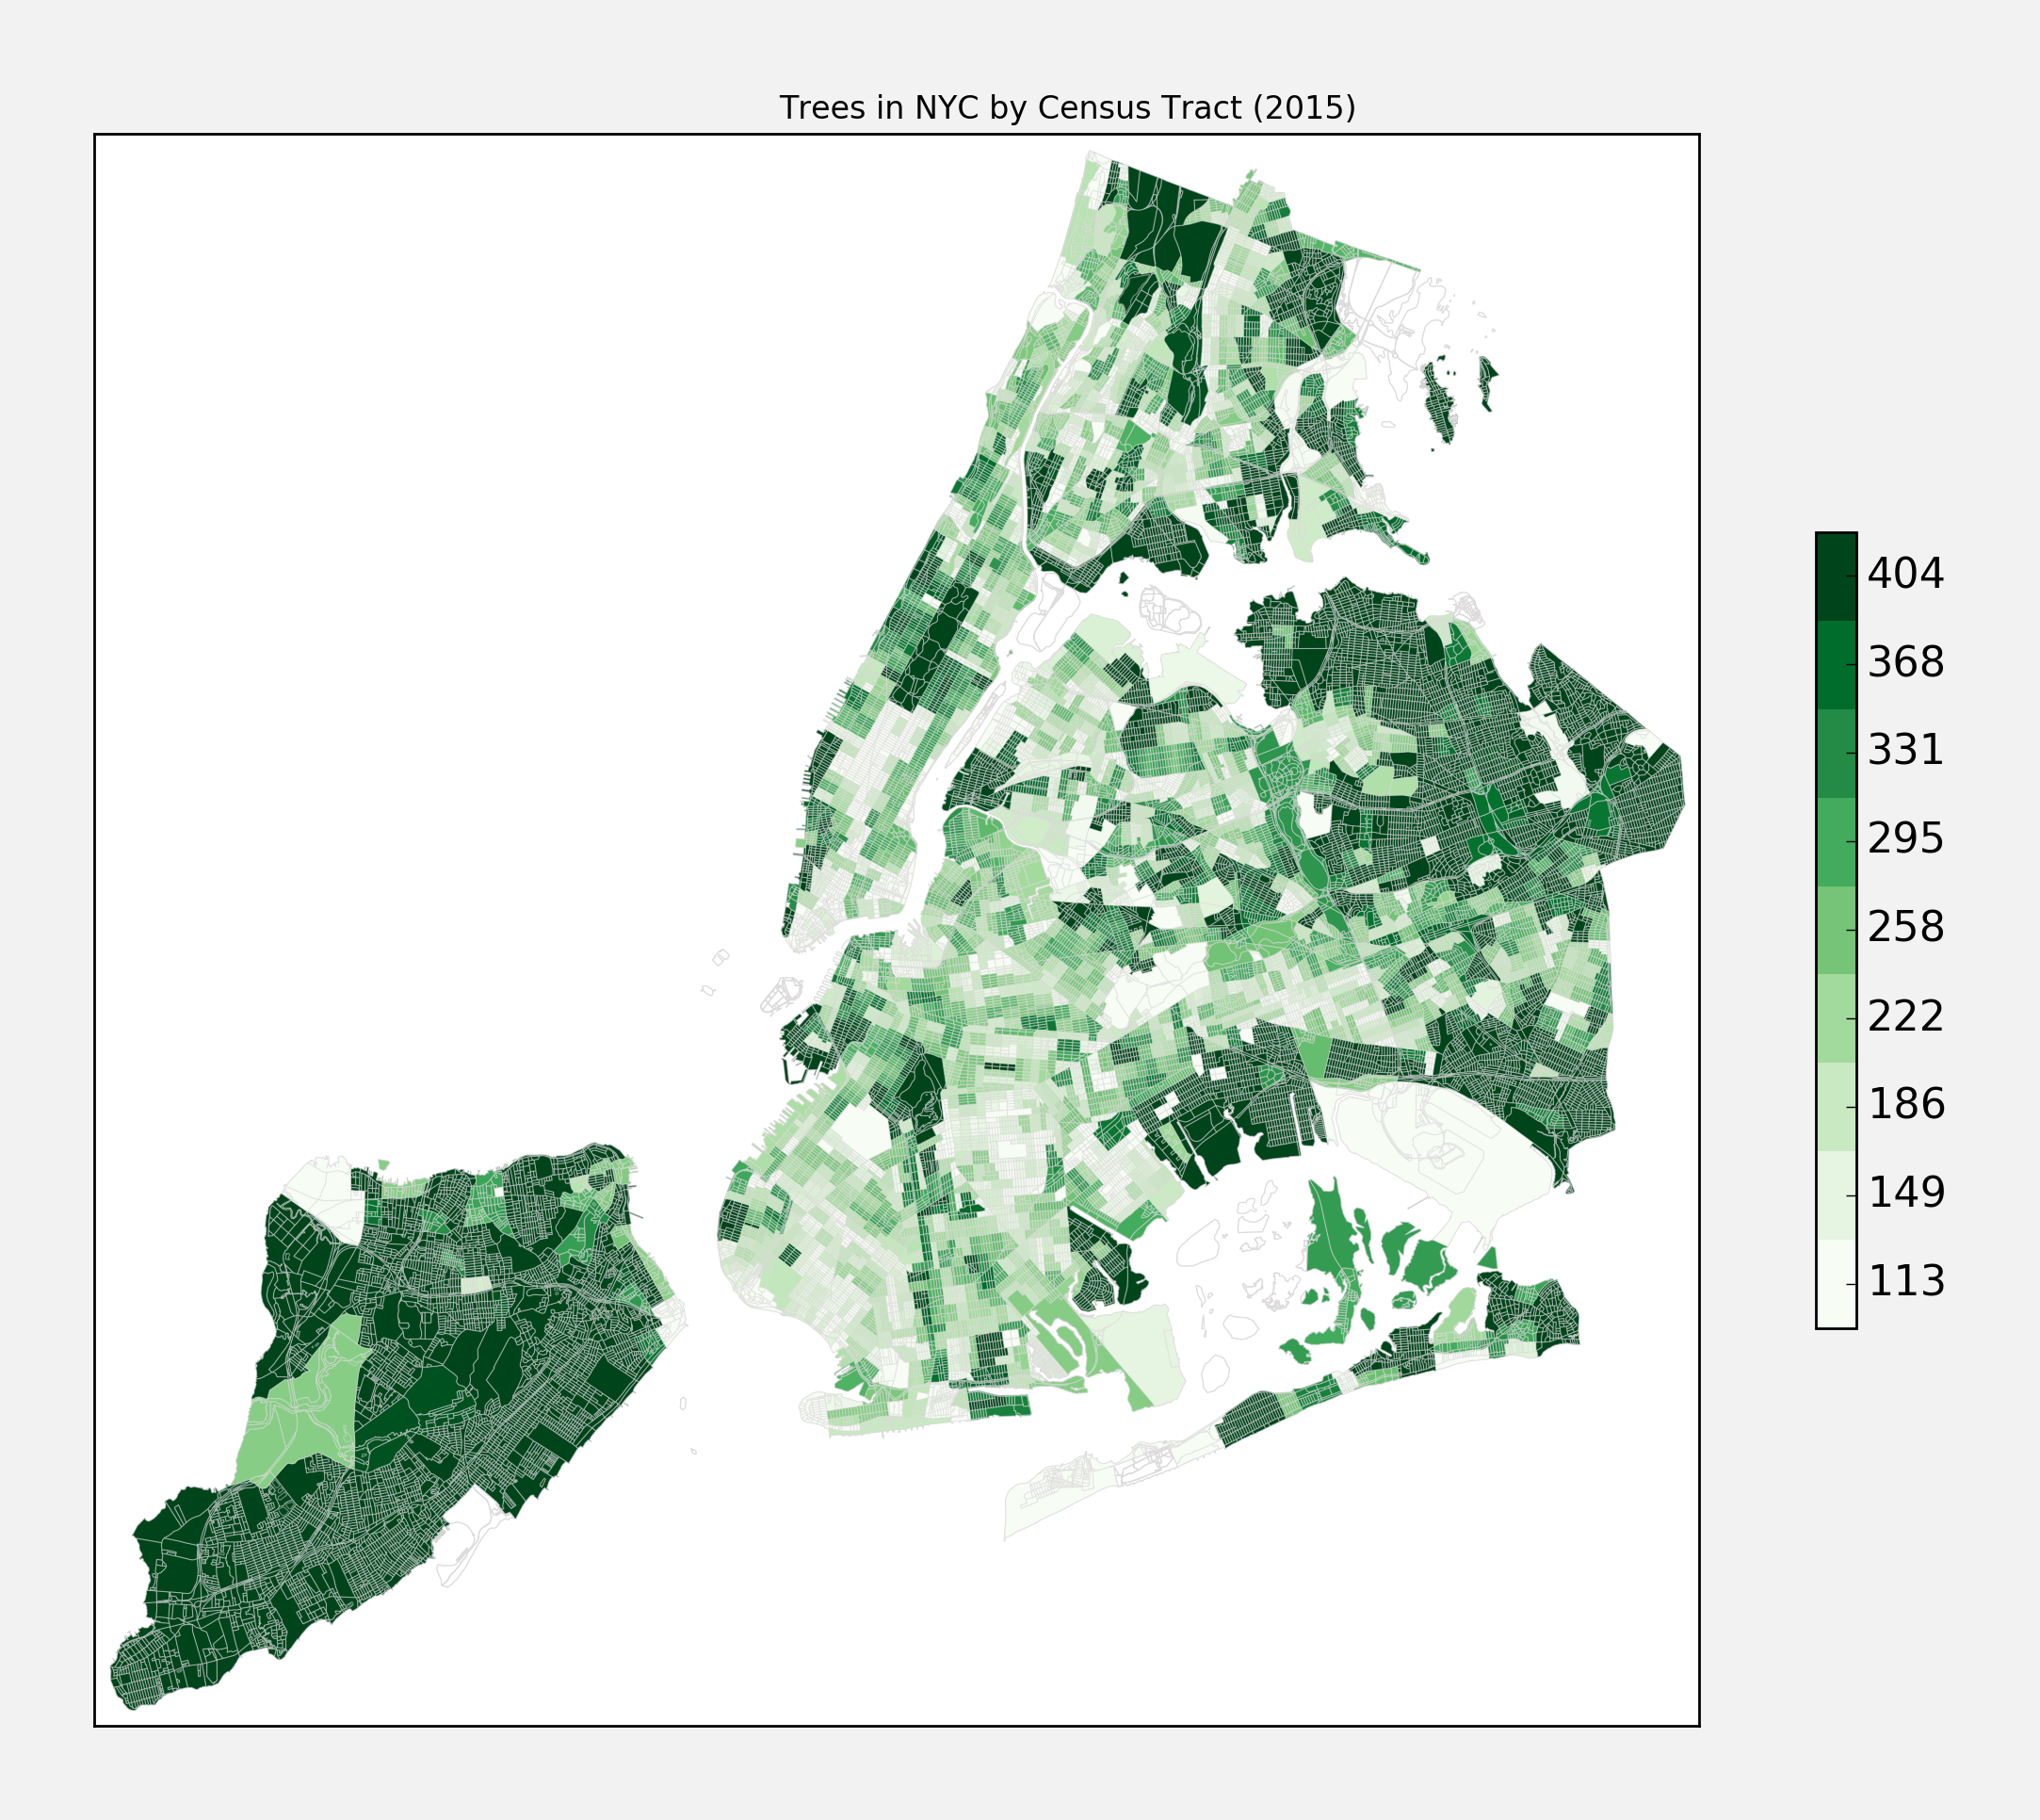
The tree count is done once every 10 years, and the first time we have data for it is back in 1995. Since then, New Yorkers have planted close to 200,000 trees along the streets - thanks in part to initiatives like the million trees project. Nice job everyone! As of the 2015 count, there are 683,774 trees planted along our city streets. In an absolute sense, Queens ranks as #1 with 250,490 trees, Brooklyn is in second with 177,276 trees, and Staten Island takes the bronze with 105,317 trees (the Bronx has 84,880 and Manhattan rounds out the bottom, with 65,722 trees). Note, we are talking about trees planted along streets, so places like central park do not count.
Here is what the counts look like overall, broken down by census tract:
Since census tracts are of varying sizes, a slightly cleaner way to look at it is to consider it by density - if we normalize by the size of the census tract, we get the following:
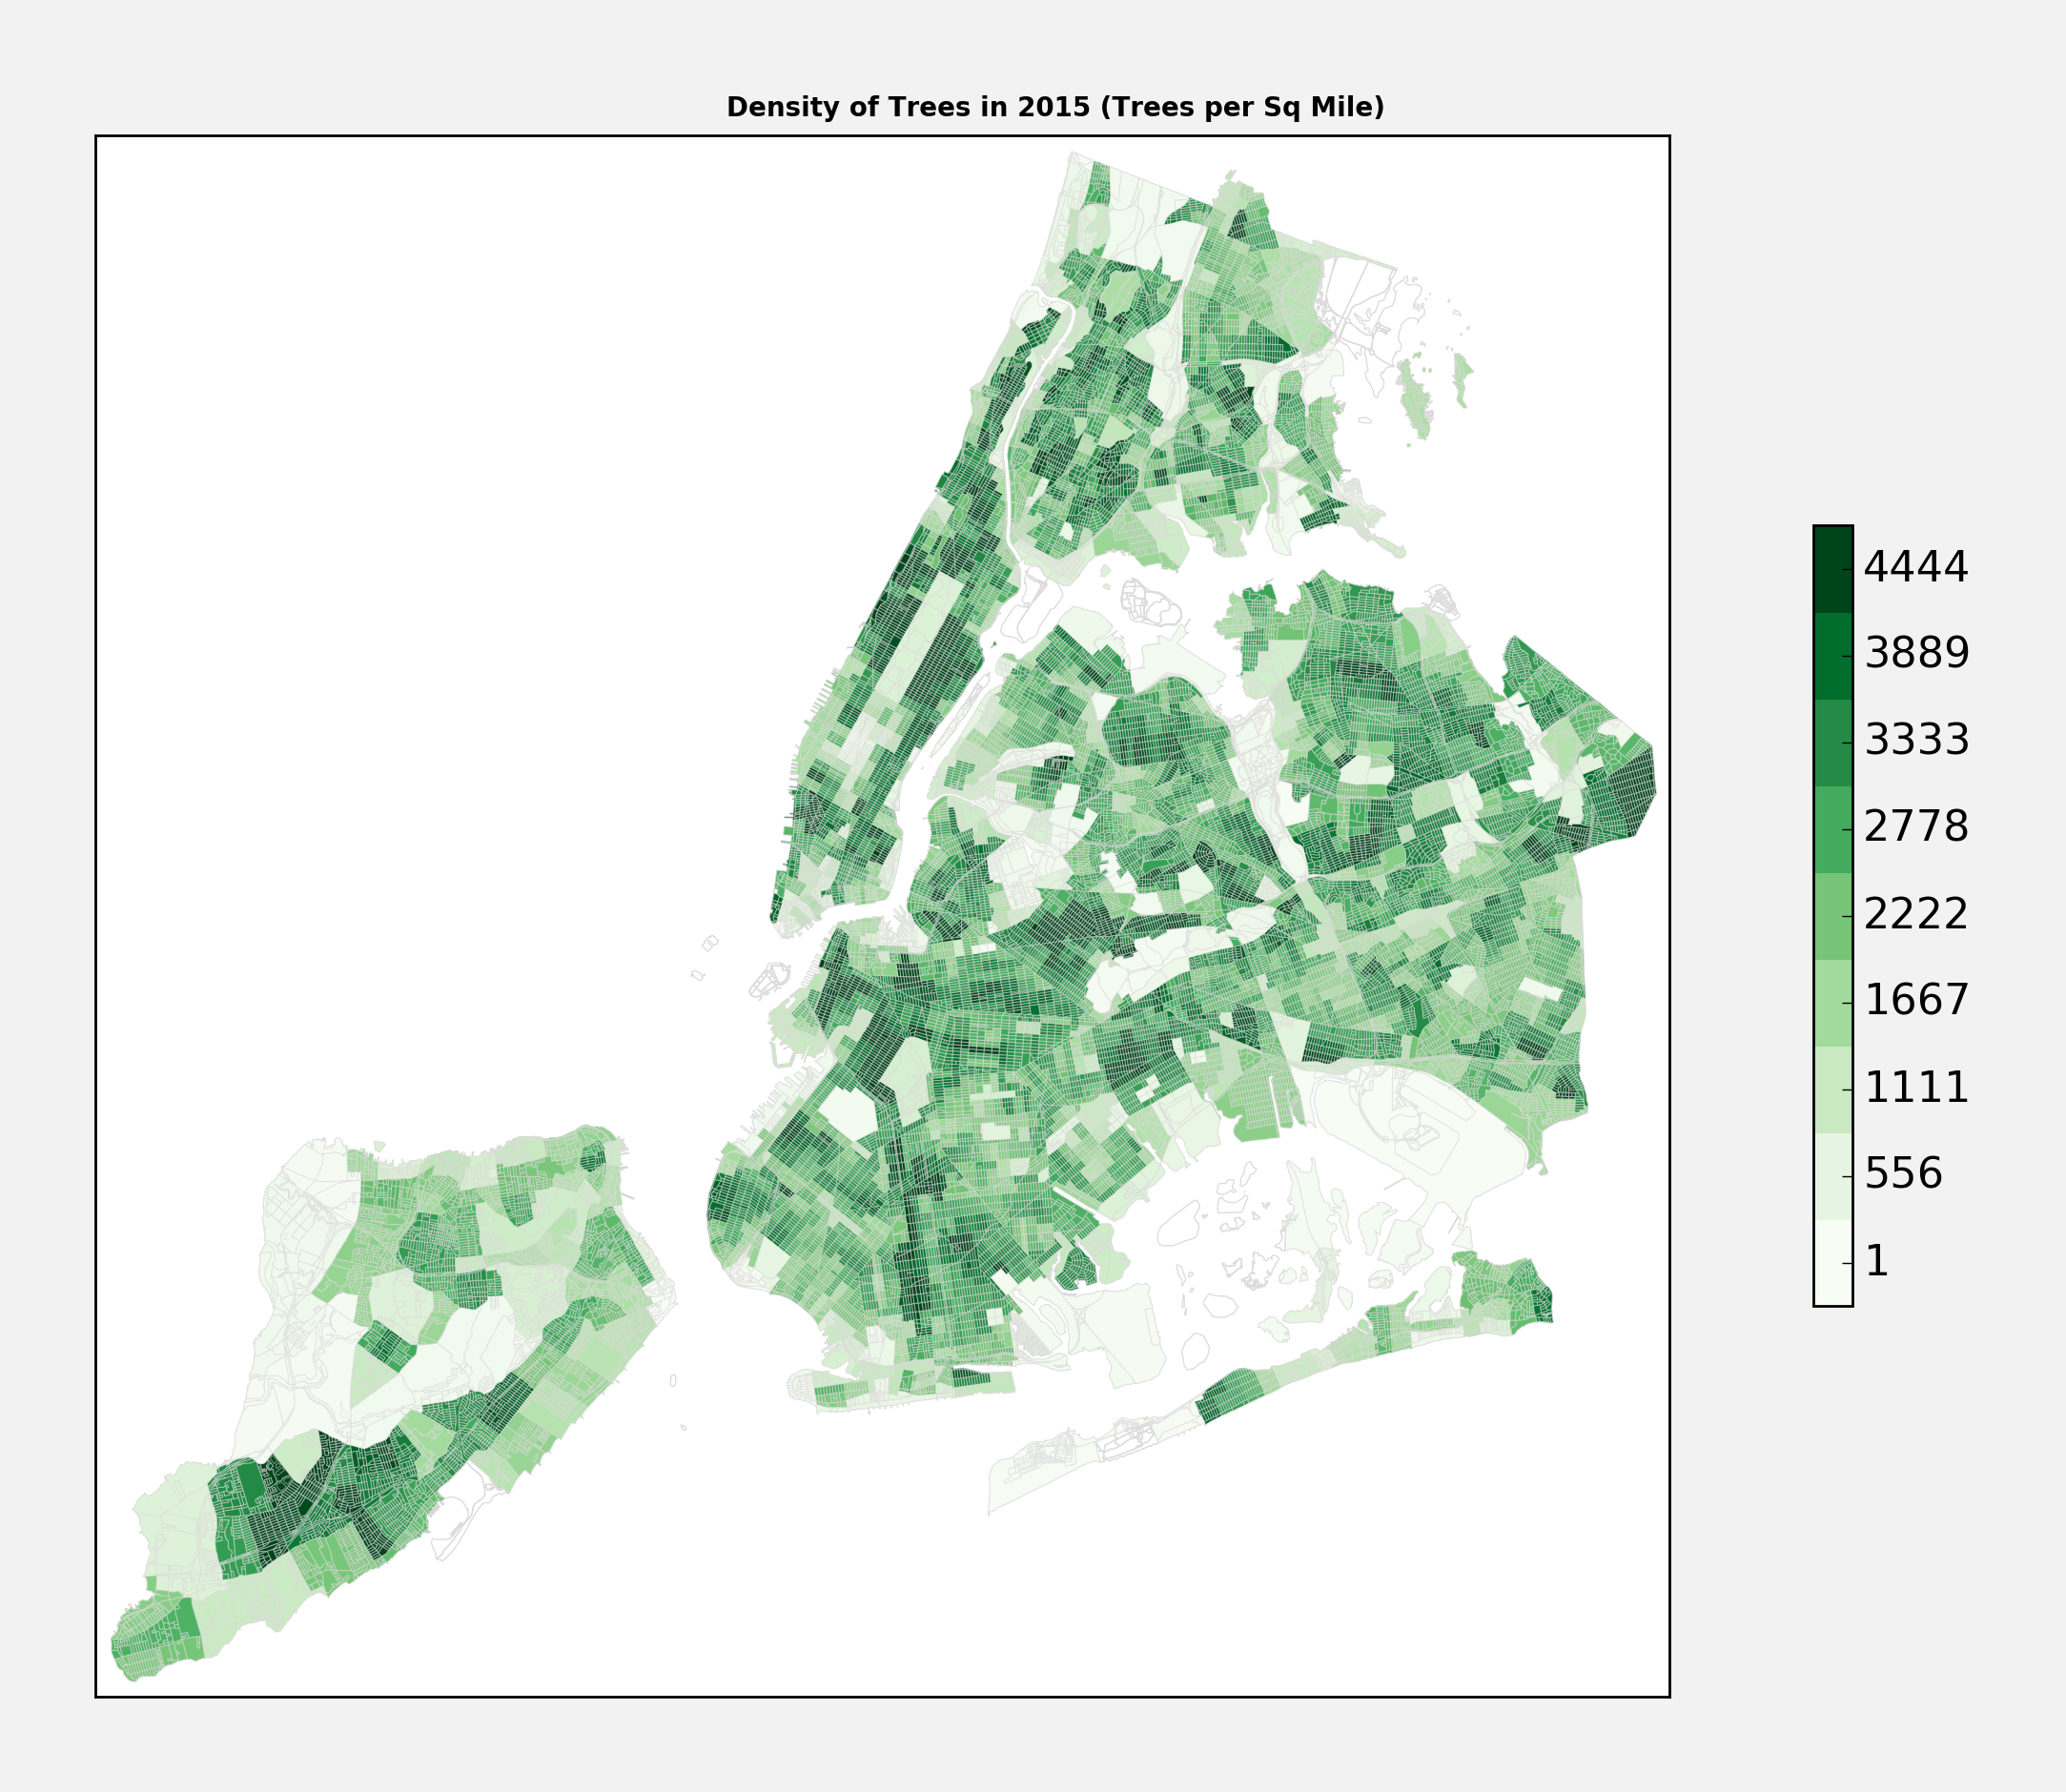
The map makes some intuitive sense - there are high tree densities in mostly residential neighborhoods, whereas industrial areas (and airports) are much lower. And it is no surprise that the financial district and midtown have some of the lowest tree density rankings in the city. There is a bit of a conspicuous blight in southern Queens (in the Blissville/Laurel Hill neighborhoods), but those neighborhoods are very industrial.
Let’s zoom in on Brooklyn:

The BK neighborhood with the most street trees is… East New York, with 9603 trees! This is largely due to its size. When we normalize by area it drops to third place; the top 5 neighborhoods are Bookyn Heights (4690 trees/sq mile), Prospect Heights (4258 trees/sq mile), East New York (4222 trees/sq mile), Windsor Terrace (4170 trees/sq mile), and lastly, Williamsburg (4107 trees/sq mile). Coney Island bottoms out the list, with 1123 trees/sq mile, less than a quarter of the density of Brooklyn Heights. Lookup where your neighborhood ranks here.
I ran regressions/correlations comparing the tree counts in each area against other factors, like the age of the neighborhoods, the income of residents, demographic make up, etc. Somewhat surprisingly, only very weak relations emerged - suggesting that those factors do not play a part in where we decide to plant trees. The strongest relationship was with age of buldings, but even that was only -24% correlated with the number of trees planted in an area.
Further Reading
There is a lot of great analysis and reading you can do about the trees in NYC. The tree count website has some interesting summary statistics/charts. I Quant NY has a good writeup, in particular where he factors in the total length of streets in each neighborhood. And there was even a data jam devoted to interesting ways to visualize/interpret the tree count data.
How to Get Involved
We can all help make our city a greener place - and after the next tree count in 2025 it would be nice to see the light spots in the maps above to get a little shade! Here are some ways you can get involved:
- Request a Tree - you can ask NYC to plant a tree on your street, or plant one yourself!
- Care for a tree in your neighborhood - Million Trees NYC gives workshops on how to care for trees in your area
- Donate - there are a lot of good initiatives going on to make our city greener. And you can donate and get some fun swag at the same time!